








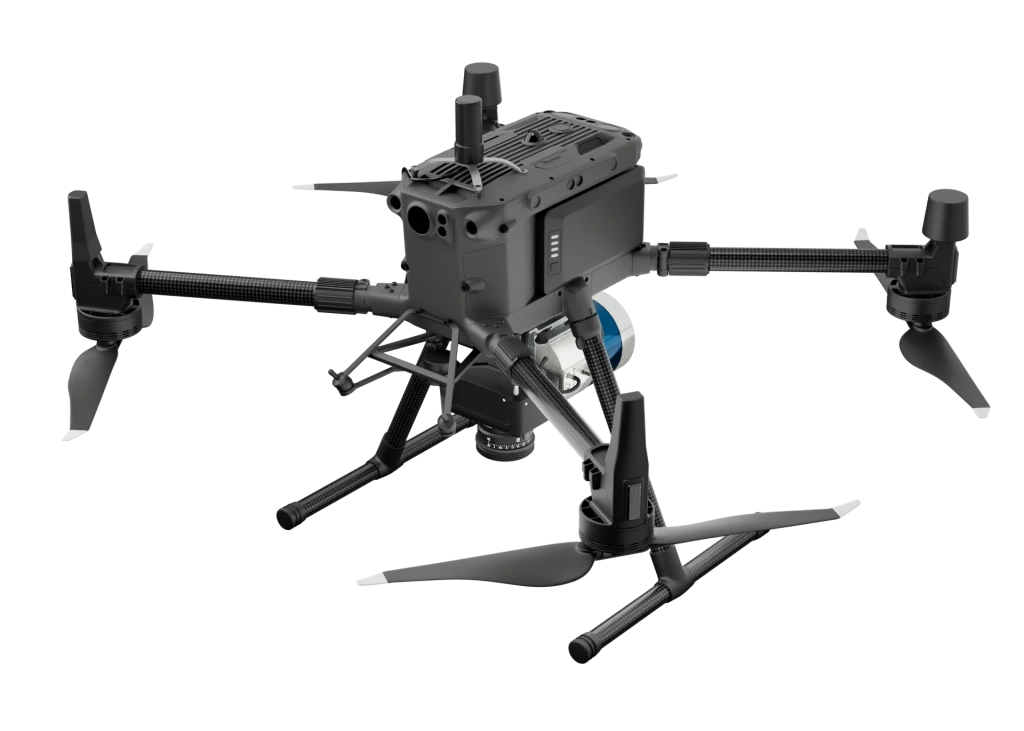
Image 1. DJI Matrice 300 RTK with TOPODRONE 200+ LiDAR and TOPODRONE P61 camera
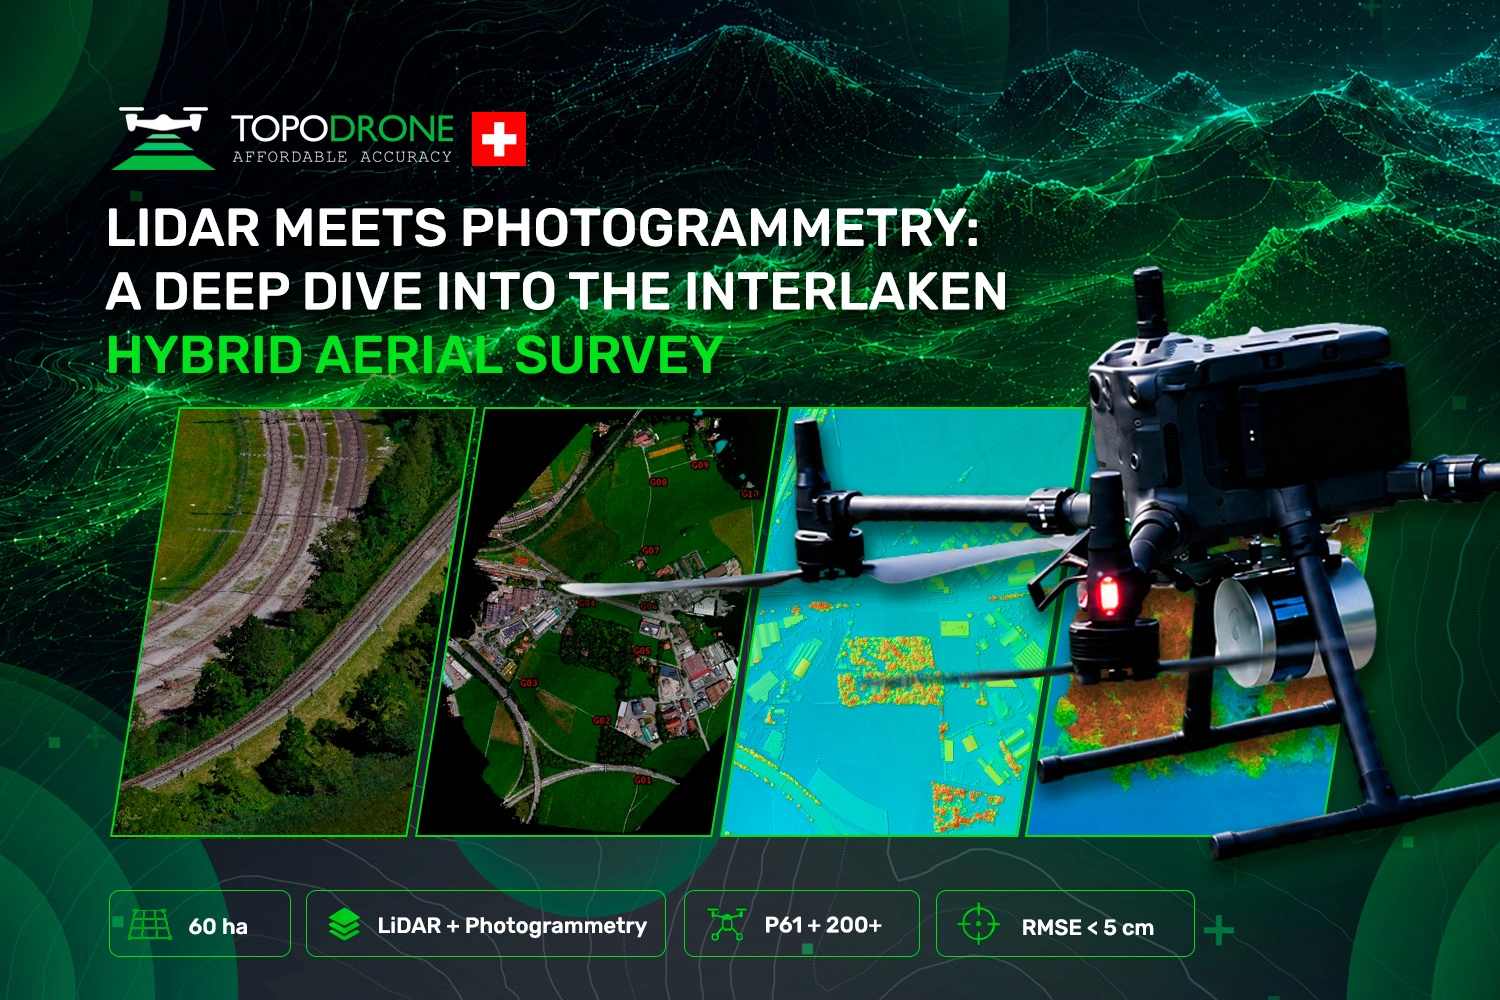
We previously touched upon our comprehensive aerial survey project in Interlaken, Switzerland, but only shared a brief, high-level overview. Given the immense interest in hybrid surveying methodologies right now, we decided it was time to remedy this and deliver the deep dive this case study deserves.
Covering 60 hectares of challenging terrain, dense urban development, and thick vegetation, this project served as a real-world proving ground for combining airborne laser scanning (LiDAR) and photogrammetry. In this post, we are moving past general summaries to focus purely on strict engineering data.
Technical Analysis: Comprehensive Geospatial Survey in Interlaken
The Interlaken project encompassed 60 hectares of terrain, comprising urban development, roadways, railway infrastructure, and areas of varying vegetation density. The primary objective was the rapid acquisition of a digital archive for the specified site.
Overall, the project workflow shaped up into the following key phases:
reconnaissance
GNSS surveying
of control points
setup
50% overlap
at 120 m, with
80% and 60% overlap
TOPODRONE P61
TOPODRONE
200+
TOPODRONE Post
Processing
dense cloud in
Agisoft Metashape
point cloud generation in TOPODRONE Post Processing
control points
inspection for
artefacts and
noise
classification
DTM, point cloud
spot heights
To ensure maximum efficiency, precision, and comprehensive data coverage, we chose a hybrid workflow that brought together photogrammetry and ALS (Airborne Laser Scanning).
- Photogrammetry:We utilised the TOPODRONE P61 camera, equipped with a full-frame sensor and mechanical shutter, to capture highly detailed RGB data and generate seamless orthomosaics.
- Laser Scanning: We deployed the versatile TOPODRONE 200+ laser scanner. Featuring a 360° field of view, a measurement range of up to 300 metres, and multi-echo support, it successfully penetrated the dense canopy to deliver a clean ground-level point cloud.
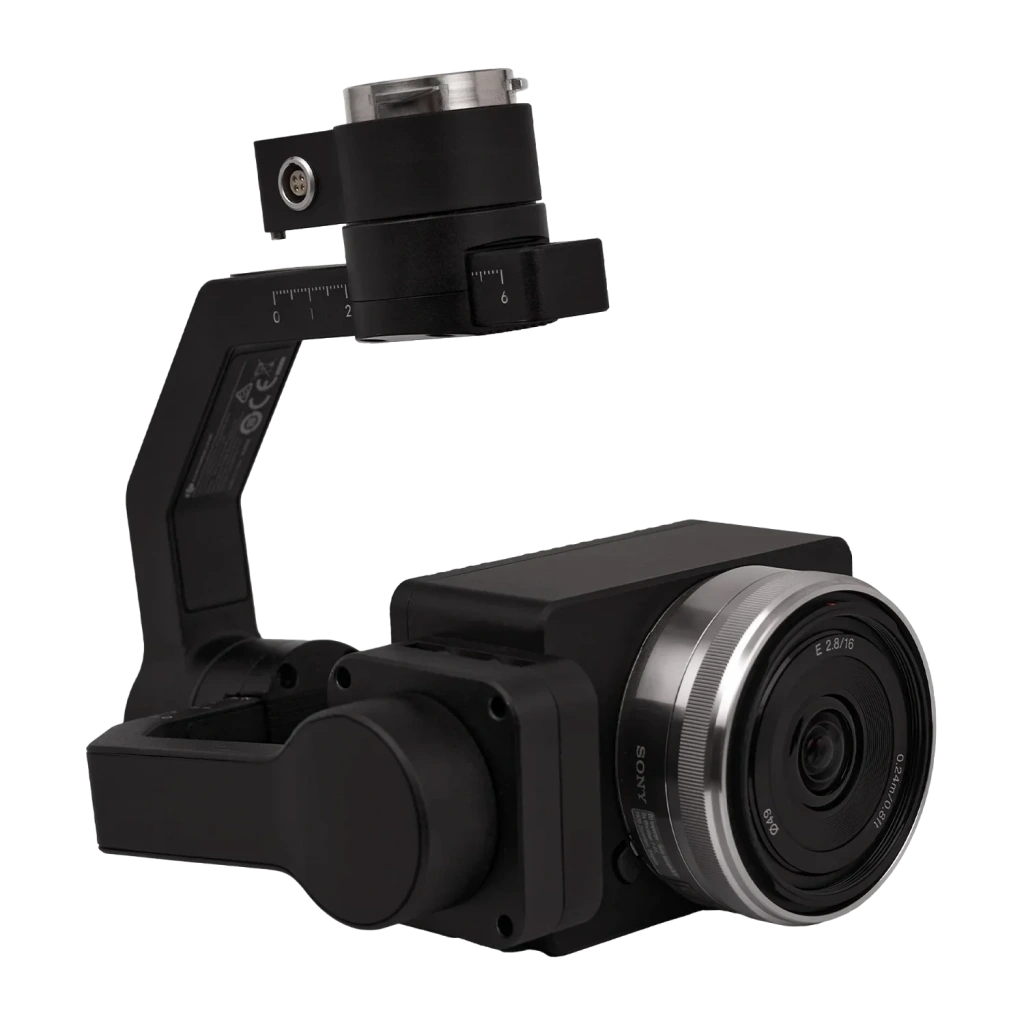
Image 2. TOPODRONE P61 photogrammetric camera
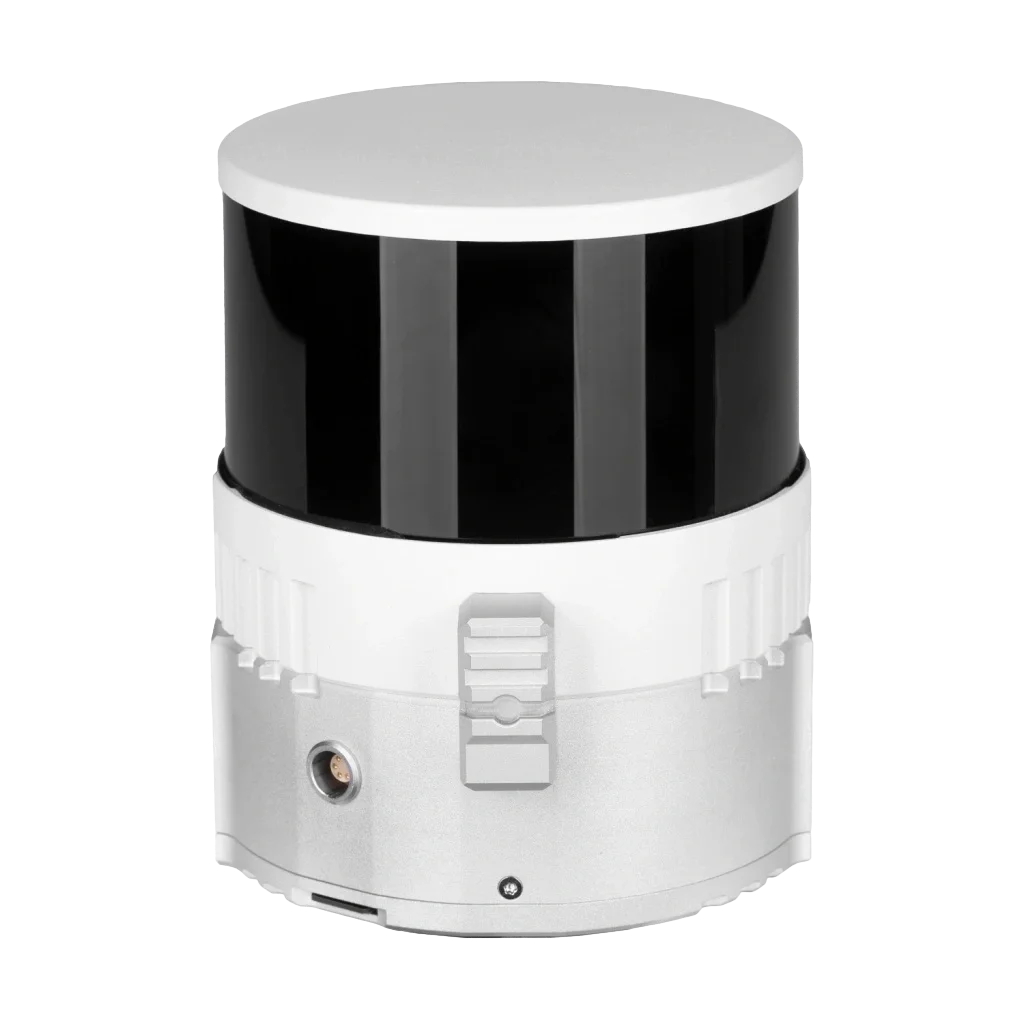
Image 3. TOPODRONE 200+ universal LiDAR scanner
Both payloads were mounted onto a DJI Matrice 300 RTK industrial drone platform, with flight paths planned using UgCS Expert software.
- Pre-flight calibration: A mandatory calibration manoeuvre was executed before the main flight to ensure trajectory stability and guarantee sufficient point cloud density.
- Photogrammetry parameters: Flying at an altitude of 120 metres, we set the forward overlap to 80% and side overlap to 60%. These optimal parameters ensured a robust bundle adjustment and delivered a highly accurate terrain model.
You can see how the mission planning looked in practice in the screenshot below:
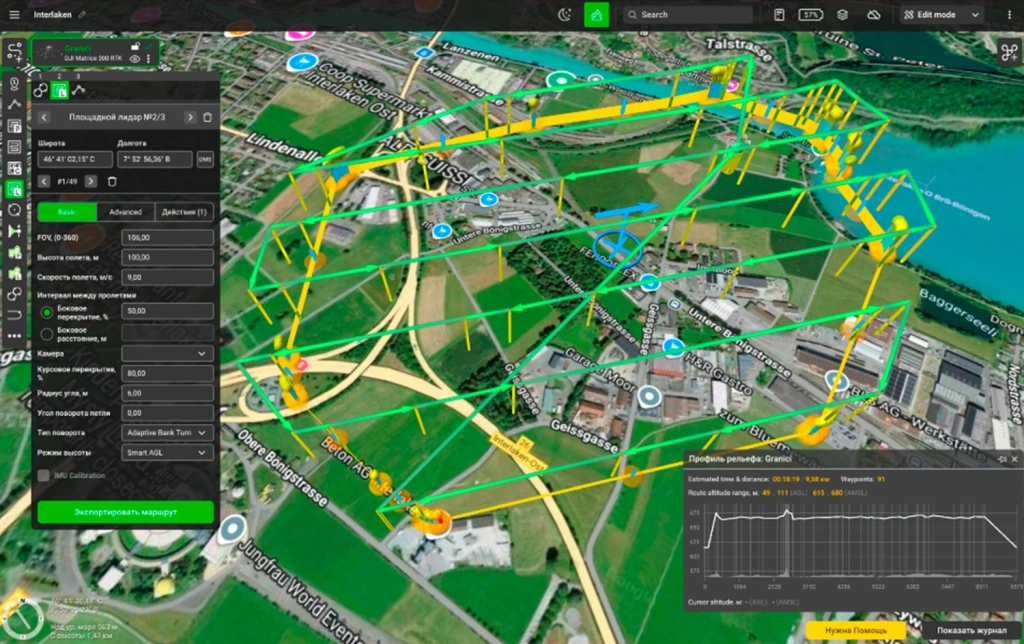
Image 4. Flight route planning in UgCS
Fieldwork
Полевые работы
Once the flight paths were locked in, we carried out a site reconnaissance (scouting the area) and, working closely with the client, laid out ground control points (GCPs) to verify accuracy. Their precise coordinates were meticulously measured using professional GNSS equipment.
To ensure the centres of these points could be identified without error in the drone imagery, we used specialised "hourglass" targets. These points became the project's "gold standard", allowing us to:
- Validate the high precision of the photogrammetric model;
- Cross-check the quality of the airborne LiDAR data;
- Provide an independent quality control check at every stage of data processing.
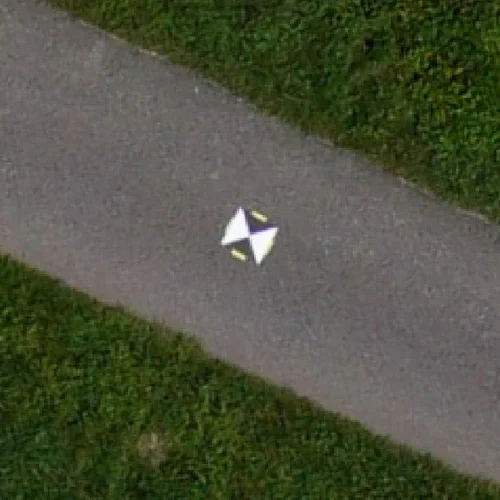
Image 5. One of the control points
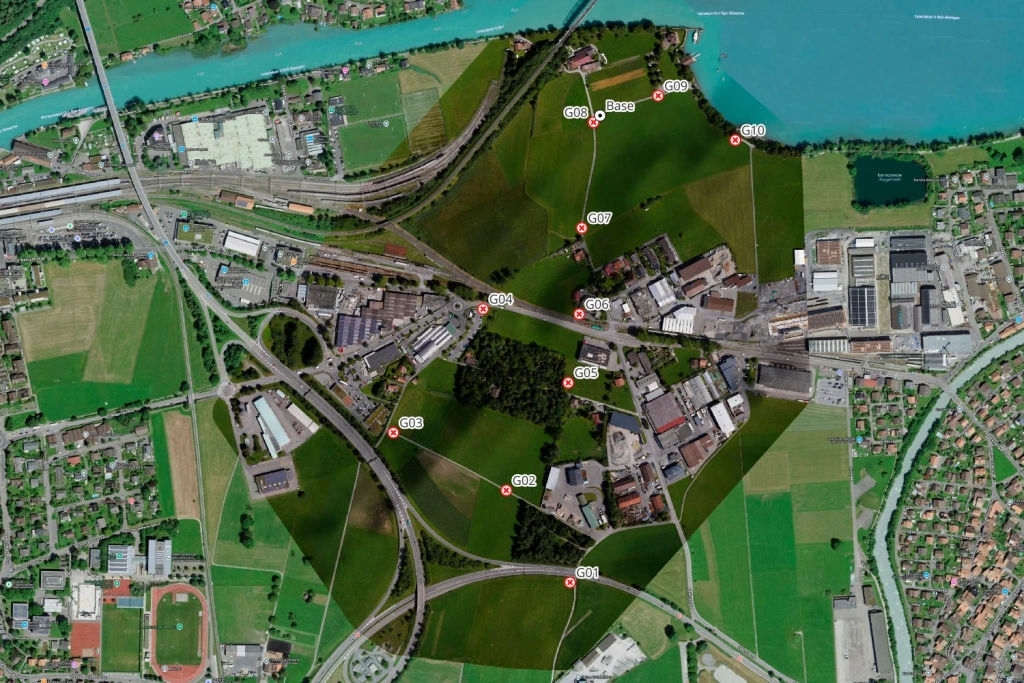
Image 6. Marking ground control targets and planimetric/elevation surveying of control points on the map
Data Processing
With the fieldwork wrapped up, we moved on to the most critical phase: desk-based data processing. To guarantee maximum precision, we split the workflow into two consecutive stages: photogrammetric data processing and airborne LiDAR data processing.
Photogrammetric Data Processing
To generate our orthomosaics and 3D models, we chose Agisoft Metashape. This software package covers the entire end-to-end workflow, from aerial triangulation right through to the generation of the final models.
1. GNSS Data Processing
We processed the GNSS data using TOPODRONE Post Processing (TPP) software. The trajectory calculations are driven by RTKLib algorithms, enhanced by proprietary data processing and synchronisation solutions. TPP fully supports local coordinate systems and geoid models, delivering the highly accurate camera exposure stations required for correct image adjustment.
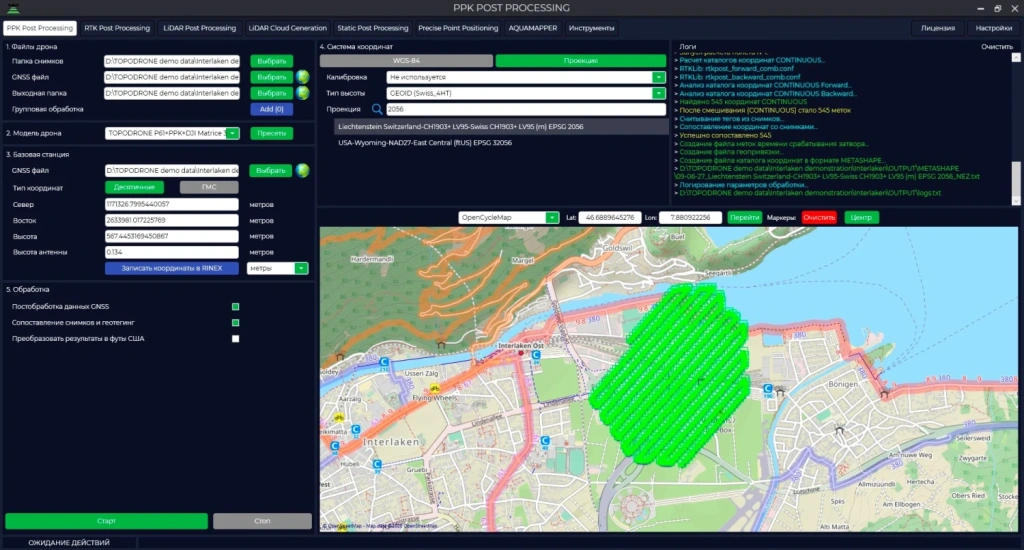
Image 7.Photogrammetry data post-processing in TOPODRONE Post Processing software
2. Aerial Triangulation and Modelling
Armed with the precise coordinates of the camera exposure stations, we performed the aerial triangulation in Agisoft Metashape. This allowed us to generate a dense point cloud, which formed the foundation for both the 3D models and the final orthomosaic.
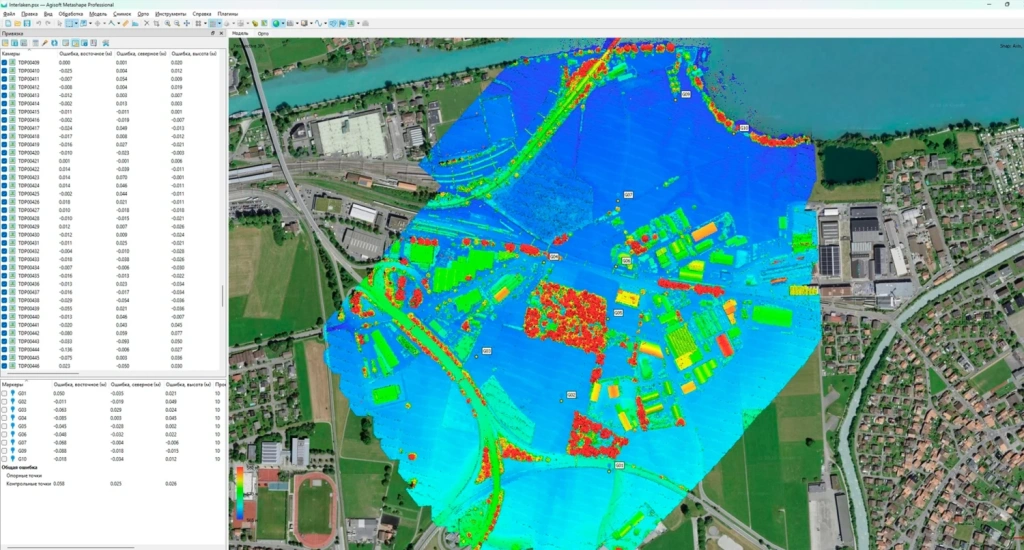
Image 8.Dense point cloud generation in Agisoft Metashape
3. Quality Control
The accuracy of the model was validated using independent ground control points (GCPs). The mean error was under 5 cm across all axes, fully meeting the stringent requirements for 1:500 scale engineering surveys.
The table below outlines the accuracy assessment for the photogrammetric data:
Total Error (GCP):
- Easting: 0.027 m
- Northing: 0.019 m
- Elevation: 0.025 m
Once the aerial triangulation was complete, a dense point cloud was generated based on the sparse point cloud. This data was then used to produce:
- A Digital Surface Model (DSM);
- A Digital Terrain Model (DTM);
- A high-resolution orthomosaic of the survey area.
Utilising the dense point cloud provided a highly detailed view of both the terrain and the onsite infrastructure. These final deliverables served as a core component of the project's engineering survey outputs.
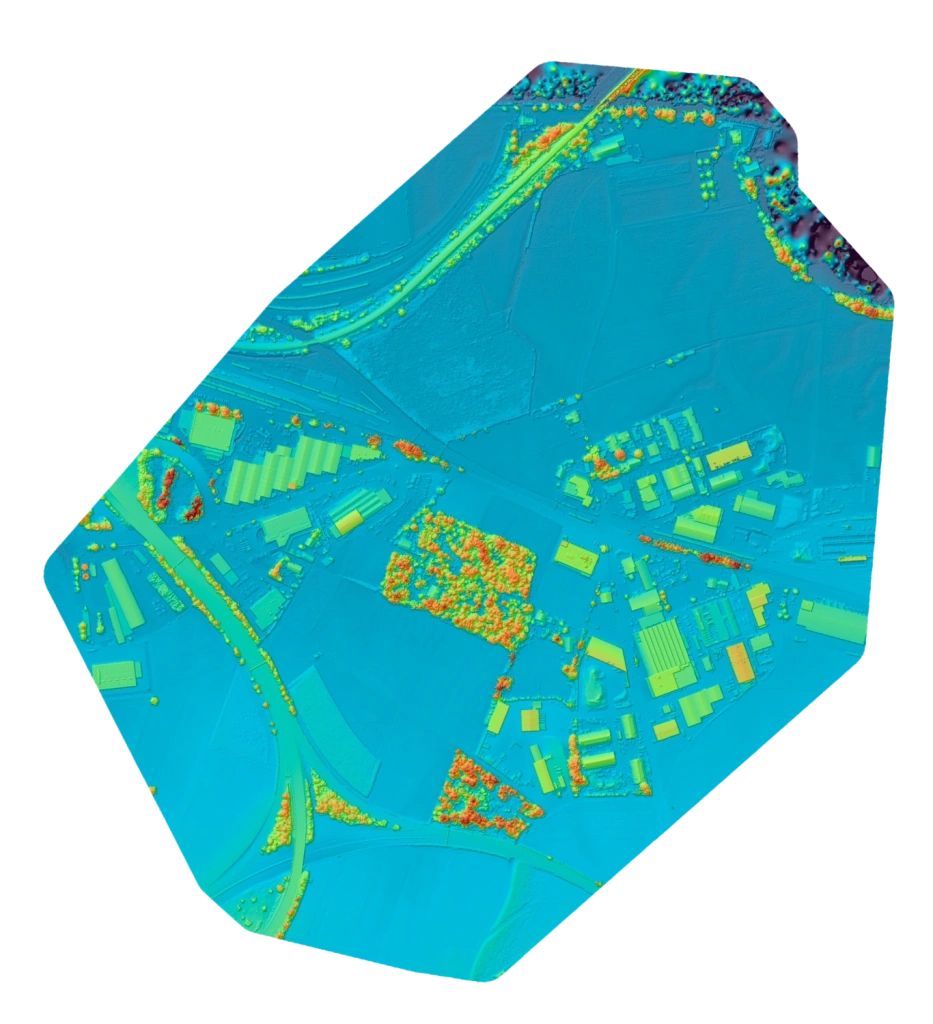
Image 9. Digital terrain model
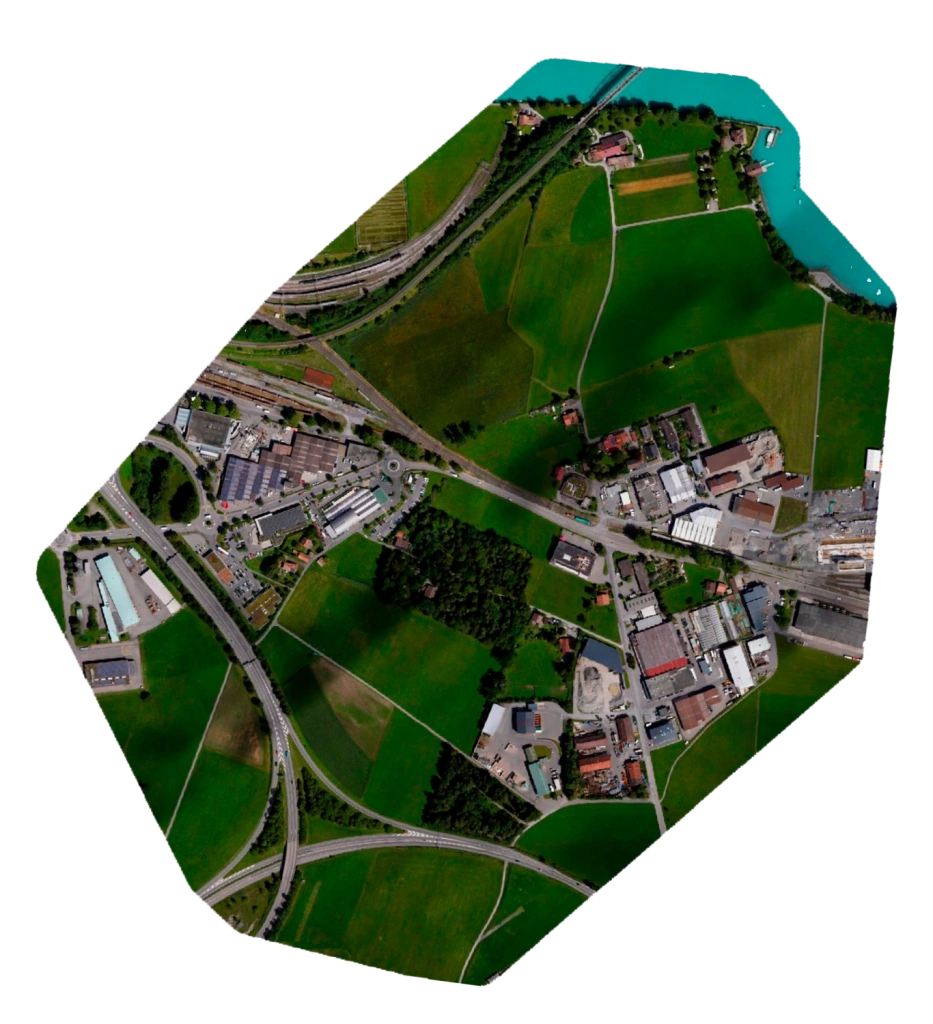
Image 10. Orthophoto of the area
LiDAR Data Processing (ALS)
To acquire high-precision spatial data and accurately map the terrain, we adopted an integrated approach combining the capabilities of TOPODRONE Post Processing (TPP) and LiDAR360 software. This setup delivers an end-to-end workflow, right from raw data processing through to the generation of the final point cloud.
1. Trajectory Generation
Within the LiDAR Post Processing (TPP) module, the 10 Hz GNSS data and 200 Hz Inertial Measurement Unit (IMU) data are processed simultaneously. This allows us to generate a highly accurate, smoothed trajectory (SBET), which forms the vital foundation for a high-quality point cloud.
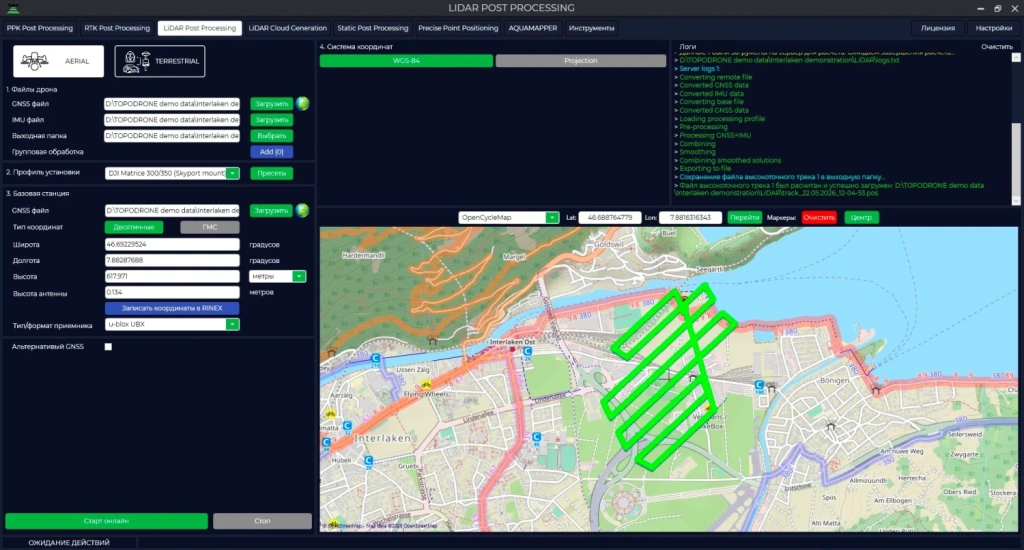
Image 11.Trajectory calculation in the LiDAR Post Processing module (TPP)
2. Point Cloud Generation
In the LiDAR Cloud Generation (TPP) module, the data was converted into the final point cloud, with each point assigned precise spatial coordinates, an intensity value, and a timestamp.
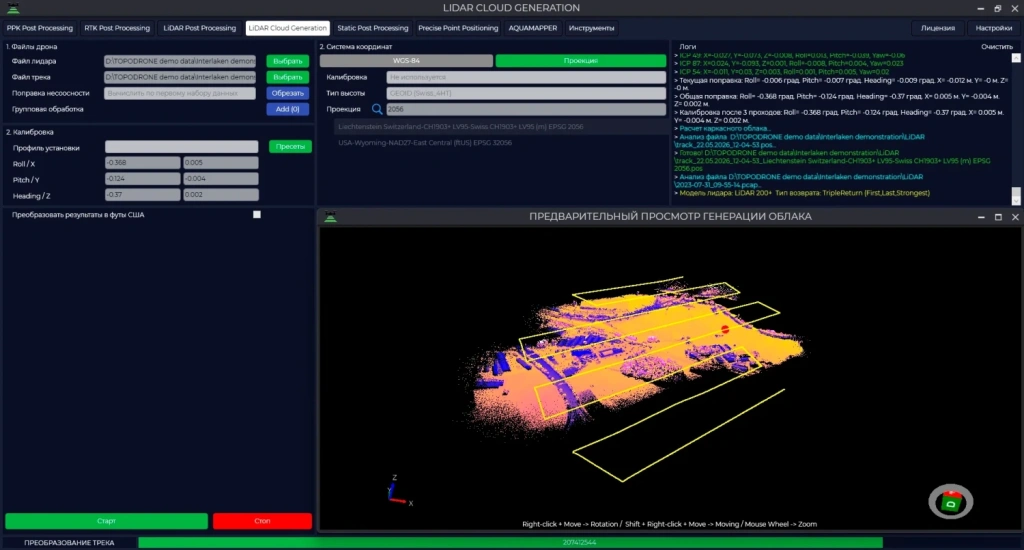
Image 12.Point cloud generation in the LiDAR Cloud Generation module (TPP)
3. Classification and Analysis
Final data cleaning and analysis were carried out in LiDAR360. The point cloud was first filtered to remove noise and resolve any strip misalignment (duplicate points), and then classified into key layers:
- Ground (for generating an accurate terrain model);
- Vegetation (trees and shrubs);
- Buildings;
- Road surface.
Thanks to this advanced classification, we were able to "see" the bare earth exactly where photogrammetry falls short: beneath dense tree canopy. This combination of methodologies delivered an exceptionally complete and reliable model of the site, fully ready for the engineering design phase.
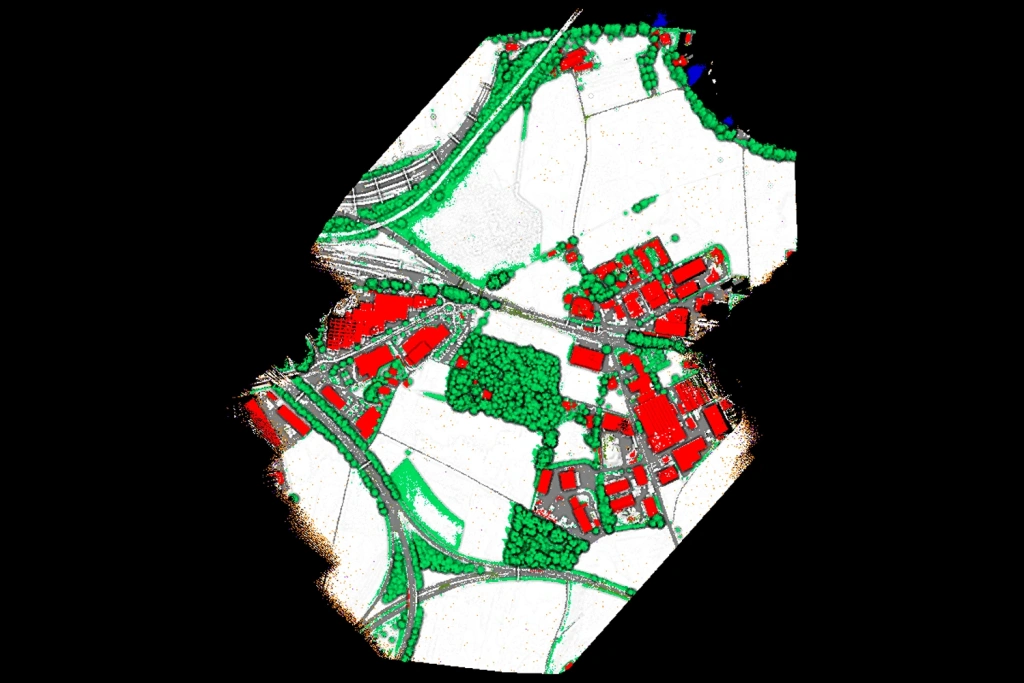
Image 13. Classified point cloud
- By elevation;
- In true colour (RGB);
- By classification;
- By intensity.
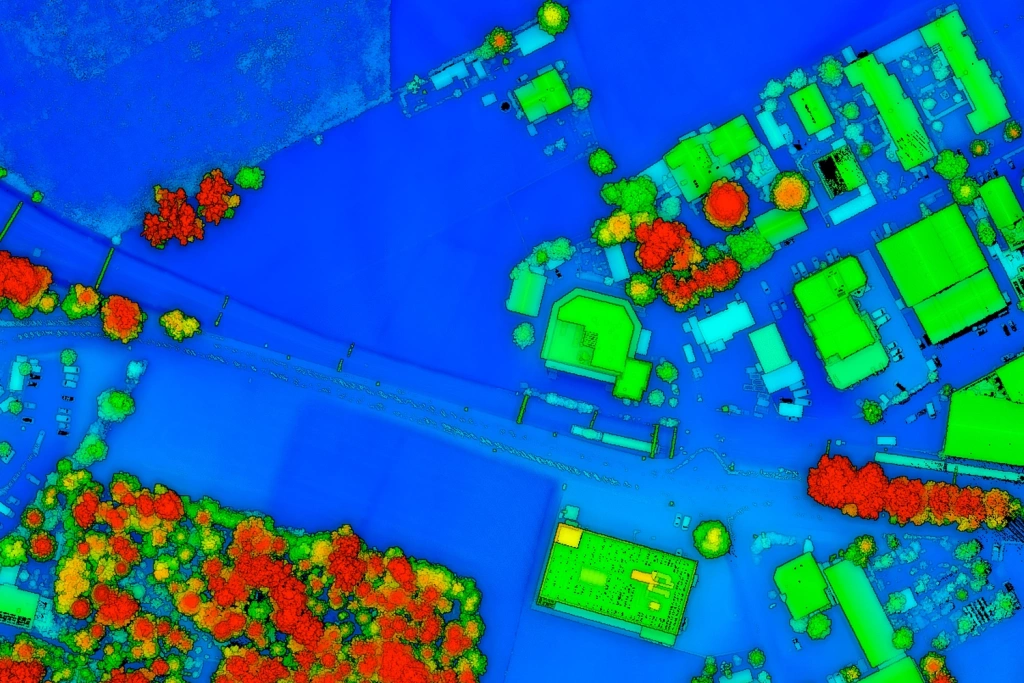
Image 14. Point cloud visualisation by elevation
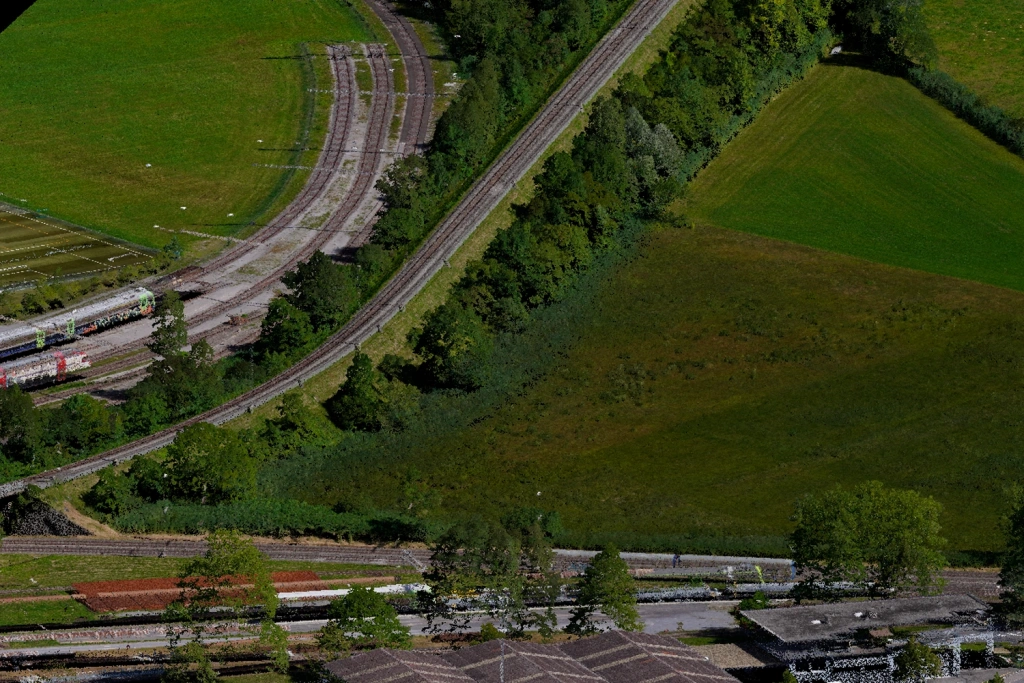
Image 15. TOPODRONE 200+ universal LiDAR scanner
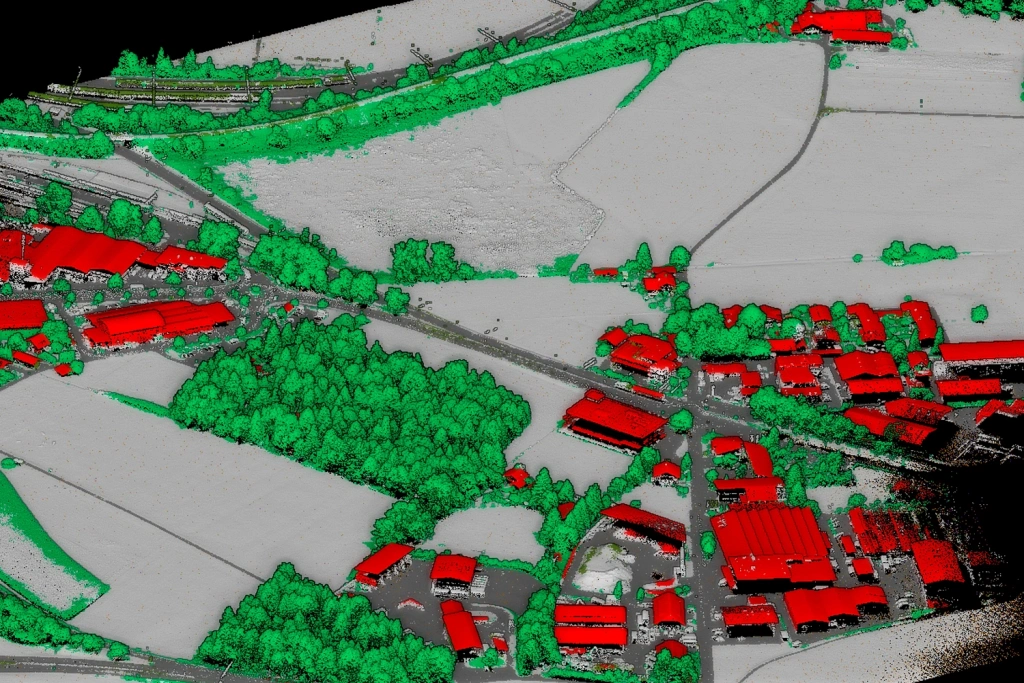
Image 16. Point cloud visualisation by classification
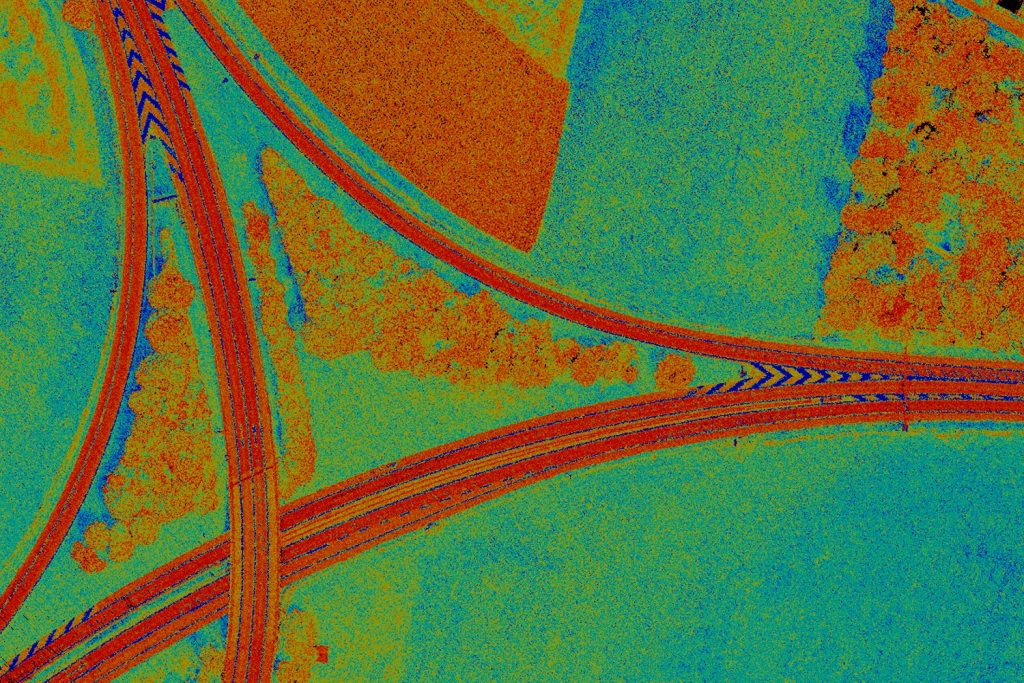
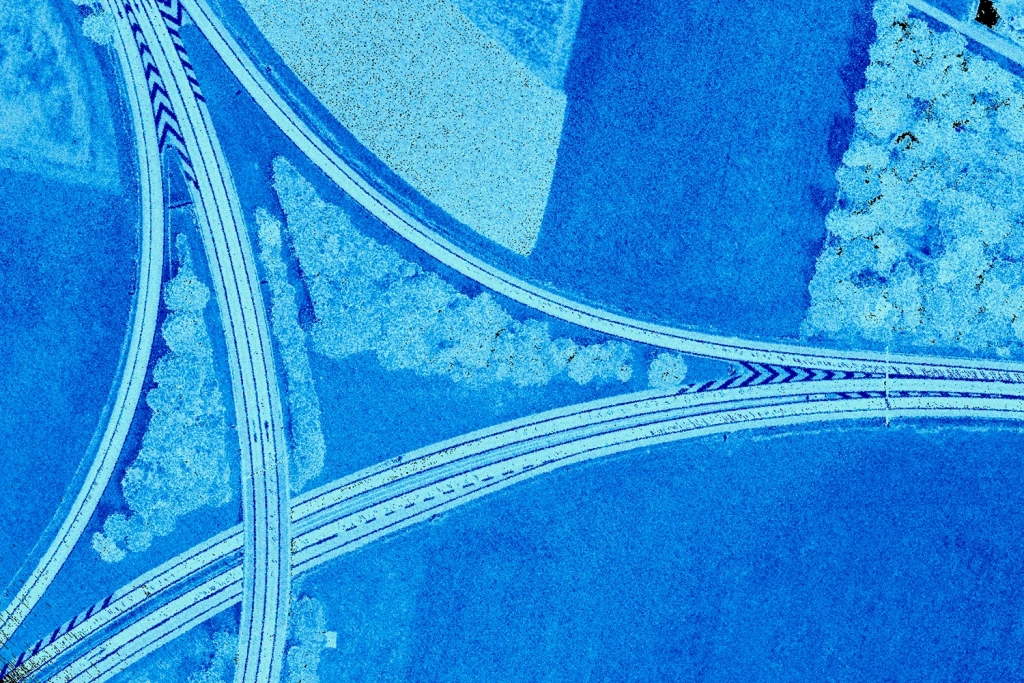
Image 17-18. Point cloud visualization by intensity
Intensity-based rendering enables automated or semi-automated feature extraction, including road surface boundaries, which can then be used to calculate asphalt surface areas.
Airborne LiDAR Quality Control
The accuracy of the final model was verified using independent check points. The maximum deviation was within 5 cm, confirming the correctness of both the navigation solution and the survey parameters. This fully complies with engineering surveying requirements for a 1:500 scale.
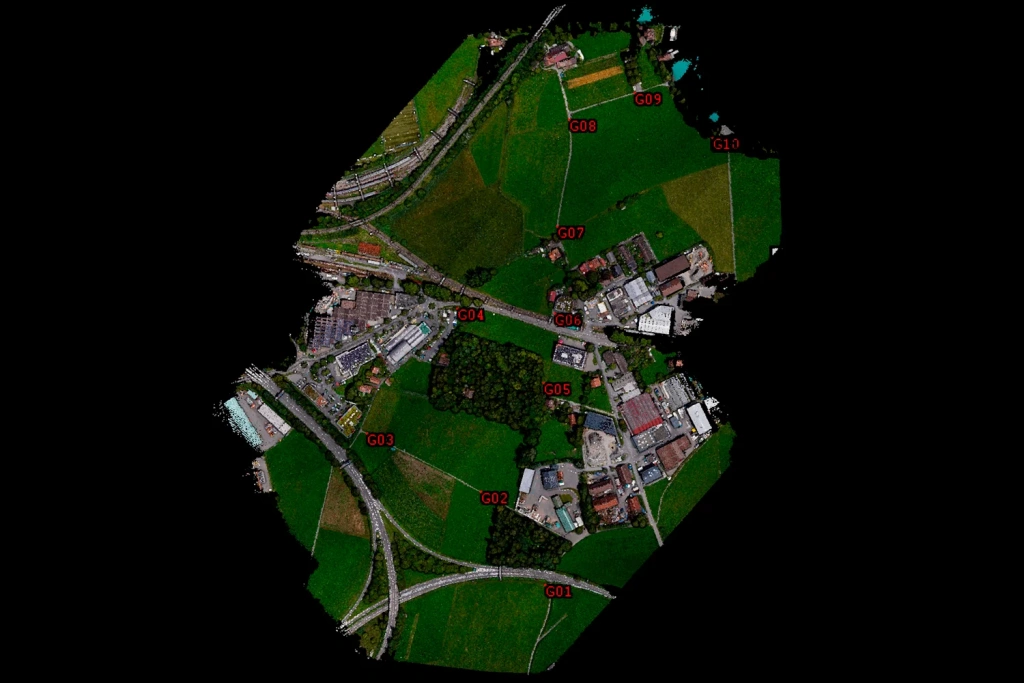
Image 19. Point cloud visualization by intensity
The airborne LiDAR accuracy assessment table is presented below:
- Mean deviation: 0.029 m
- Standard deviation (Std Dev): 0.030 m
- Root Mean Square Error (RMSE): 0.028 m
- Mean Z deviation: -0.015 m
- Minimum Z deviation: -0.048 m
- Maximum Z deviation: 0.029 m
Visual quality control of the point cloud:
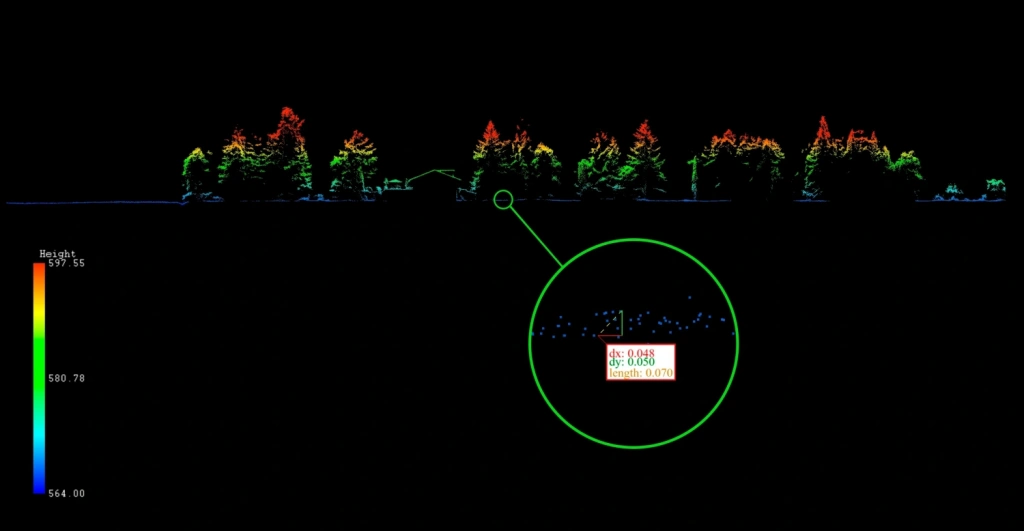
Image 5. Cross-section with fixed height
Point density analysis across the entire survey area:
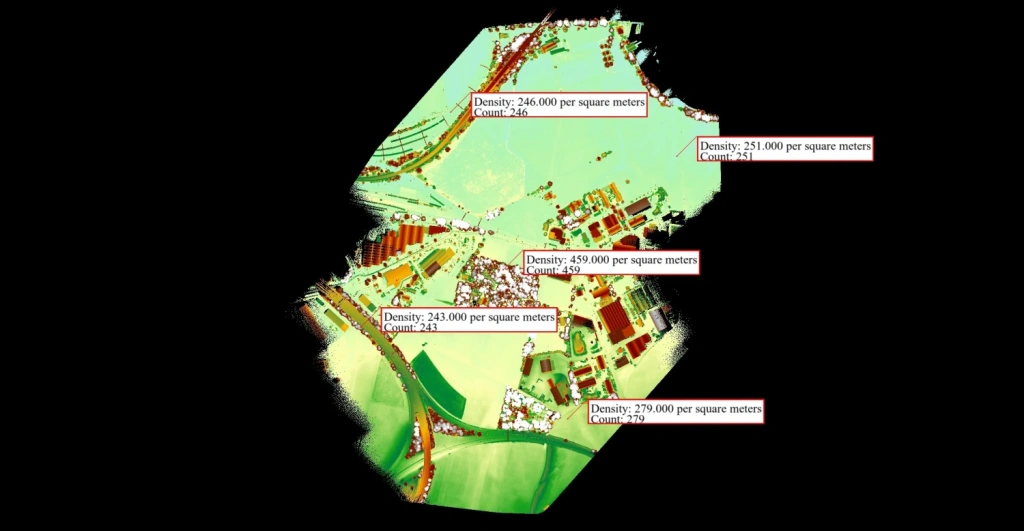
Image 20. Cross-section with fixed height
The image below displays the overlapped point cloud data captured via photogrammetry and airborne laser scanning (LiDAR). The photogrammetric point cloud is rendered in true colour, while the LiDAR data is displayed by intensity.
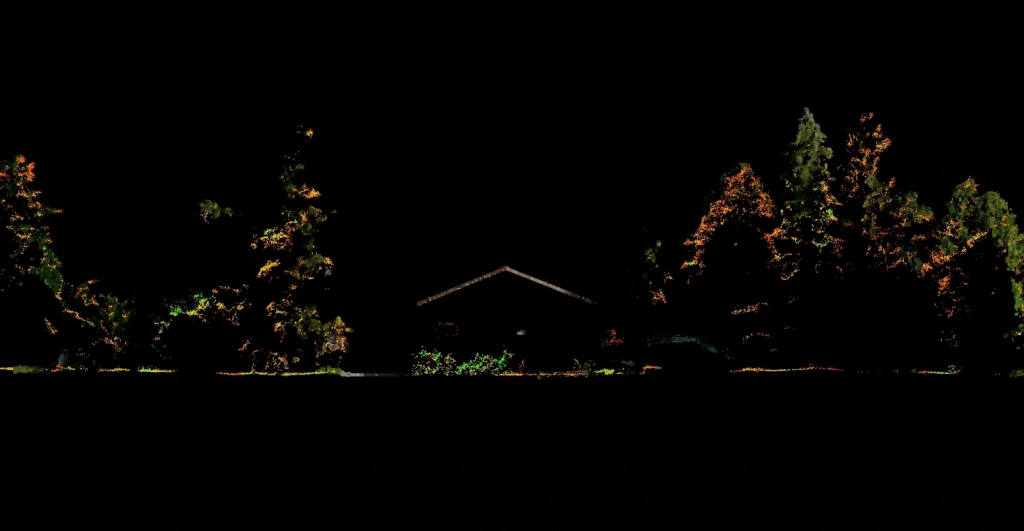
Image 21. Merged point cloud data from photogrammetry and airborne laser scanning
The screenshot clearly demonstrates that photogrammetry fails to generate a dense point cloud beneath the tree canopy, whereas LiDAR successfully captures ground surface data. This confirms that laser scanning is essential for accurate terrain modelling in forested areas.
A comparison of the two data processing results for the same area is presented below, contrasting photogrammetry with airborne laser scanning. This comparison highlights the differences in data density and completeness, particularly in zones with complex vegetation.
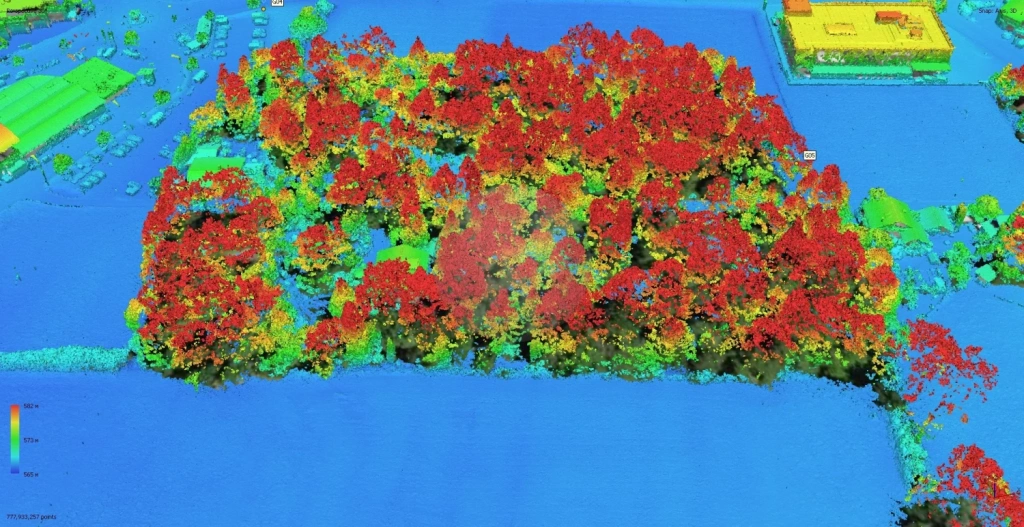
Image 22. Photogrammetric point cloud
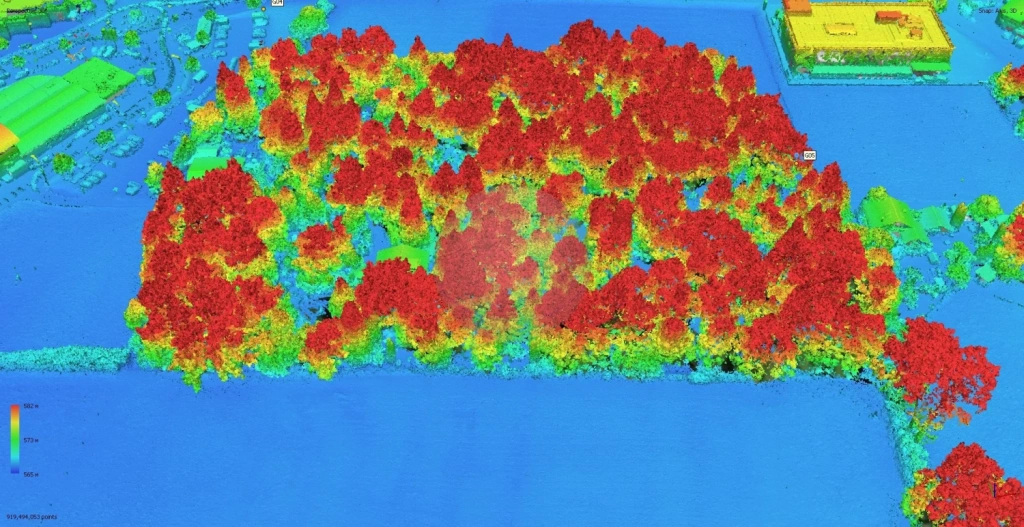
Image 23. Airborne laser scanning point cloud
Based on the airborne laser scanning data processing results, the following outputs were automatically generated:
- contours;
- spot heights.
The following deliverables were also handed over to the client:
- an orthomosaic (orthophotomap);
- a digital terrain model (DTM);
- the point cloud.
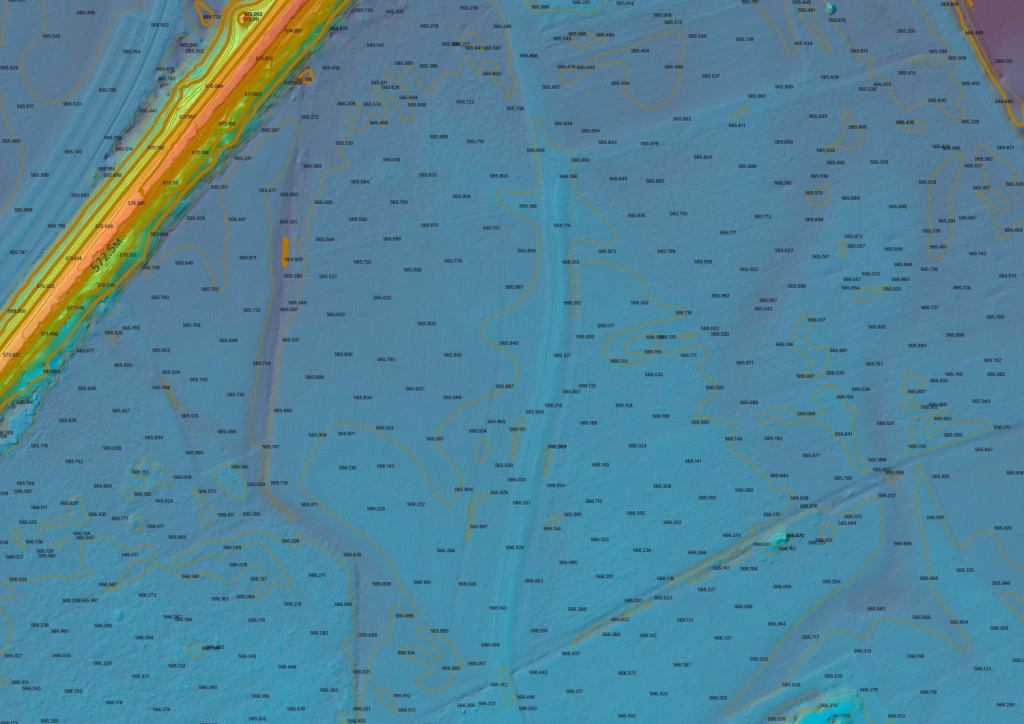
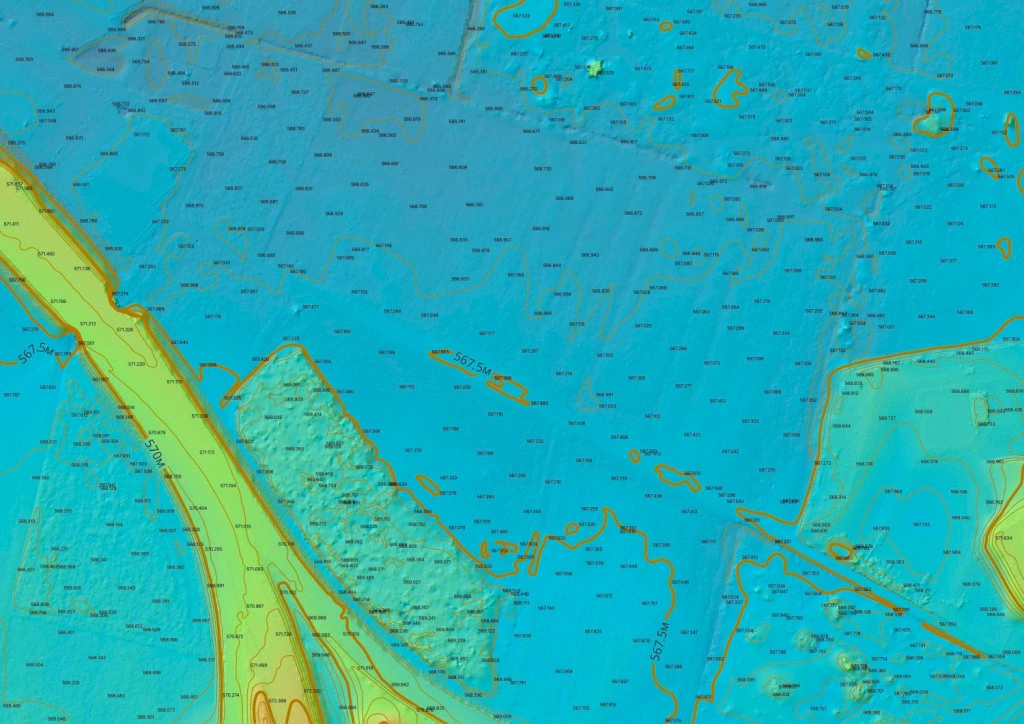
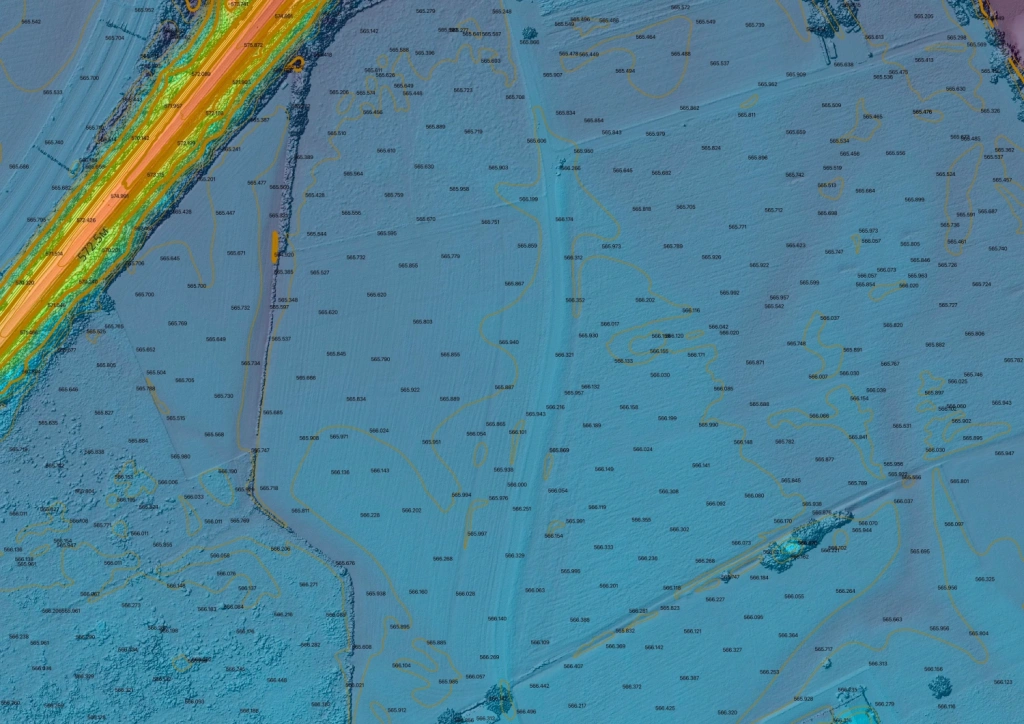
Image 24-26. Contours and spot heights
Technical Project Summary
The Interlaken survey confirms that combining airborne laser scanning (LiDAR) and photogrammetry for complex sites is both economically and technically justified. Rather than compromising between detail and penetration capability, the combined approach leverages the strengths of both methods on a single site.
Key Engineering Insights:
- Task Separation for Sensors: The TOPODRONE P61 full-frame camera met the requirement for high-precision textures and the creation of a detailed orthomosaic. Concurrently, the TOPODRONE 200+ scanner, utilizing its multi-echo mode, successfully captured data beneath the tree canopy to record the terrain.
- Achieved Accuracy: The Root Mean Square Error (RMSE) against independent ground control points (GCPs) for both methods was less than 5 cm. This fully complies with the requirements for 1:500 scale topographic surveying.
In short, the combination of airborne LiDAR and photogrammetry makes it possible to collect a comprehensive dataset in a single flight day. This data forms the basis for the final deliverables: a classified point cloud, DTM, DSM, contours, and spot heights. For sites featuring complex terrain, built-up areas, and dense vegetation, this approach currently stands as the most effective engineering solution available.