Topo-bathymetry methodology development project

This interim report is meant to present the methodology and results developed by DataDron, S.L. for the development of a new way of creating Topo-bathymetry products by using UAV’s platforms and RGB sensors.
The combination and application of photogrammetry, oceanographic, hydrographic and GIS techniques all together made possible a new surveying and data processing workflow which has proven already excellent results under certain environmental conditions and will surely improve to provide even better results.
Testing site
The testing ground is located at the SE of Tenerife Island, in Playa San Juan, Municipio de Guía de Isora (Image 1). The site consists on a small beach of artificial sand and pebbles, surrounded by mid-size cliffs. The environmental conditions at this site made it ideal for this test, as the sea water here is quite clear, and it is located at the wind shadow area from the Eastern winds (predominant winds in Tenerife).
Due to its geographical location, no special permits were required to conduct this job, as it is outside of any controlled air space.

Img. 1. Testing ground localisation.
The testing ground covers around 40.000 m² which includes a land and sea portion. The altitude range vary from -10 m (LAT) to 60 m LAT.
The geographical coordinates from the centre of the testing ground are latitude 28°10'42.87"N y longitude 16°48'39.40"W, Datum WGS84.
Methodology
Equipment used
During the data acquisition phase for this testing Project, the following equipment was used:
- TOPODRONE DJI Mavic 2 Pro PPK

Img. 2. TOPODRONE DJI Mavic 2 Pro PPK.
- Backpack GNSS Leica GS15 RTK for CGP (Control Group Points) and used as well as local ground reference station (L1/L2 GNSS RTK/PPK, 120 channels, Satellites support: GPS, GLONASS, Galileo);
- IT Hardware: Tablet NVIDIA Shield K, Dell XP15 Laptop, Processor: Intel® Core™ i7- 3630QM CPU @2.40GHz 2.40GHz, RAM: 32,00GB, Graphic card: Nvidia Geoforce 1860 GSX, OS Windows 10 pro 64 bits, MicroSD UHS-I Speed Grade 3 de 256GB;
- Software: UGCS for mission planning and flight control, DJI Go 4 to configure drone camera, Toposetter 2.0 PRO GNSS PPK postprocessing and image geotagging, Agisoft Metashape Professional 1.5.2 photogrammetry postprocessing and GIS products exportation, Global Mapper V20.1 to finalize GIS and apply Geo-functions;
Flight mission planning
To plan and manage all missions, the software UGCS 3.6225 was used. All relevant parameters required to plan properly the mission were calculated by the software. Below we can see the variables that the software calculates to create a successful mission.
- Flight height (constant or following the terrain)
- GSD (Ground Sample Distance)
- Line offset distances based on a long line and across line overlapping
- Flight speed
- Photogram interval or photogram distance
During this testing, three flights / missions were conducted in order to test (based on previous testing results) the following:
For all flights, it was defined a polygon of 306 m x 140 m, which results in an area of 41.000 m2 parallel to the shoreline with an along track overlapping of 80% and 60% overlapping across track. Flight altitude was 78.6 m, obtaining a GSD 2.00 cm/pixel approximately (Image 3).
As it wasn’t a flat terrain all flights were set to AGL (Altitude to Ground Level) with the target of preserving the cartographic and photographic scale.

Img. 3. Mission design.
Photographic and cartographic scale calculation
In order to be able to calculate the photographic scale, we need to use the formula below: 1/Ef=f/H
- Ef = Photographic scale
- f = focal length= 10,26 mm
- H = Altitude above ground level = 78,6
Therefore, the photographic scale would be 10.26mm/78600 mm = 0.00013, OR 1/13000
Once we have the photographic scale, we proceed to calculate the cartographic scale using the formula below:Ef=K√Ec
- Ef = Photographic scale
- K = Constant of average value 200 (between 150-300)
- Ec = cartographic scale
Therefore, we get a cartographic scale of 13000 = 200√Ec, 13000/200 =√Ec, Ec = 65², Ec = 4225. So, the cartographic scale is 1 / 4.225
Table 1. Mission planning.
Best flight timing planning and weather
For this kind of job, it’s important to get good quality images and image quality is dependent on the sun’s position relative to the work site. The minimum recommended sun height is 35° above the horizon. In this case, the day and time the test was conducted, the sun height angle was 50.39° (Table 4). As the intention was to perform a Topo-Bathymetry, the light reflectivity specially at the water surface, is crucial in order to detect the sea bottom.

Img. 4. Solar position for the day of the job (http://www.sunearthtools.com/).
Below we can see the weather conditions at the work site during the test flights (img 5)

Img. 5. Weather conditions on site (https://www.uavforecast.com/).
GNSS PPK Positioning system
The UAV positioning system was a GNSS PPK. This system has a few advantages over a traditional RTK system. Among these advantages, the main ones are that we can fly over three times faster than with RTK systems and the fact that we won’t have any solution dropouts as the precise positioning is done in postprocessing phase.
For this job an official Reference Station from the Canarian GNSS network stations GRAFCAN. In this case, we have used the GNSS station placed at Santiago del Teide (STEI) at an approximate distance from site of 13 km (Image 6, 7). Data can be downloaded from: https://www.grafcan.es/red-de-estaciones.
We also used for comparison the same RTK GNSS which was used to log the GCP and an onsite local reference station by logging RINEX files and used as well in the PPK postprocessing workflow.

Img. 6. Geographical localisation from the GNSS Reference station GRAFCAN at Santiago del Teide.

Img. 7. Technical description.
Ground Control Points (GCP).
For all performed flights it was used a number of 10 GCP (Group Control Points), to control the total error from the photogrammetry and georeferencing from all images, see image 7. Apart from the GCP, we also measured the height / water depth at 4 different points in order to do a gross cross check error on how well the methodology used fitted with reality.

Img. 8. GNSS Leica GS15 RTK used as local reference station logging Rinex files.

Img. 9. Localisation and distribution from GCP (Group Control Points).
The GPC loggings were taking using a GNSS Leica GS15 RTK linked via NTrip to Santiago del Teide Reference station. The coordinate description for each GCP is described in table 2.
Table 2. GCP. Geodetics: WGS84 UTM 28N (EPGS: 32628).

Img. 10. CGP used markers.
Post-processing workflow.
A total of 100 pictures were taken per flight.

Img. 11. Pictures distribution for the photogrammetry missions.
The workflow stages consisted of the following steps:
- GNSS PPK solution postprocessing and geotagging of all images. This step was done by using the software TopoSetter 2.0.
- Photogrammetry postprocessing (photo alignment, point cloud creation, DEM, DTM, and Orthomosaic). This set was done using the software Agisoft Metashape Professional 1.5.2.
- Use of GIS Global Mapper to analyse and produce Topo-Bathymetric products.
Error control by GCP.
A total number of 10 ground control points were taken, in order to control the TPE (Total Propagated Error) across the entire survey. All the errors, including the submerged area was always below 10 cm.

Img. 12. Total Propagated Error for the entire project.

Img. 13. Ground Control Points calculated errors.
Focal length calibration.
Using the GCP, we can calibrate the camera’s focal length and once is satisfactory, we can use it for further flights or missions. During this job, the calculated focal length was given in pixels (4369.44515 (pixels)) and we have applied the formula below to convert it to mm. F=(Fp*Sensor Width)/(Image Width)
Where:
- F (Focal length in mm)
- Fp (Focal Length in pixels) = 4256
- Sensor Width = 25.4 mm
- Image Width (in pixels) = 5472
Therefore, the calculated focal length has been 19.75 mm, which can be used for all different flights.
High quality topo-bathymetry products
Once all previously mentioned calibrations have been applied, and the dense point cloud generated, we exported it as a lidar file and further postprocessing techniques are used in order to produce high quality Topo-bathymetry products. All data for such matters has been processed using the software GlobbarMapper v20.0.

Img. 14. Point cloud detail.
The creation of Topo-bathymetry products from RGB images, has consisted in the following steps:
- Dense Point Cloud Creation and exportation as .laz file.
- DEM creation.
- DEM correction from Ellipsoidal height to Geoidal height. The Geoid model used in this case has been the official one called EGM08_REDNAP_Canarias. A fix vertical offset (Geoid – Ellipsoid) distance was used. The value used was -45.4994m which brings the vertical plane to LAT level.
- Tide level at LAT plane at the time of the survey.
- Air / Water function and refraction coefficient (sea water) application.
Physics theory used to correct DEM and submersed data to accurate levels is shown below:

Img. 15. Light refraction physics used to correct the bathymetric data extracted from RGB .
The used tidal data to reduce the DEM to LAT was extracted from the official tide gauge placed at Los Cristianos from Puertos del Estado (www.puertos.es). The tide gauge is placed at Los Cristianos Port which is placed at 37 km from our site (Image 18).
We finally produce a DEM which not only has high accuracy topographic data but also bathymetric data.
Note that the tidal height registered at the time of the flights was 0.552 m above chart datum.

Img. 16. Technical description from the tidal gauge.
Results
Bathymetric data error check
As there wasn’t available a boat with an echosounder, the best way to cross check the measured error, was to measure with a measuring tape and a weight the water depth at 4 fixed buoys. After measuring the water column depth, the tidal reduction was applied and then compared against the final DEM. The results can be seen in the table below:
Img. 17. Details from used buoys to measure wáter Depth for cross check error.
As we can see above, the results are very satisfactory, considering the tidal data is from a tide gauge at 37km distance, and that the water depth is been measured as previously mentioned measuring tape method. The errors stated in the table above are above what we could expect.
Final products.


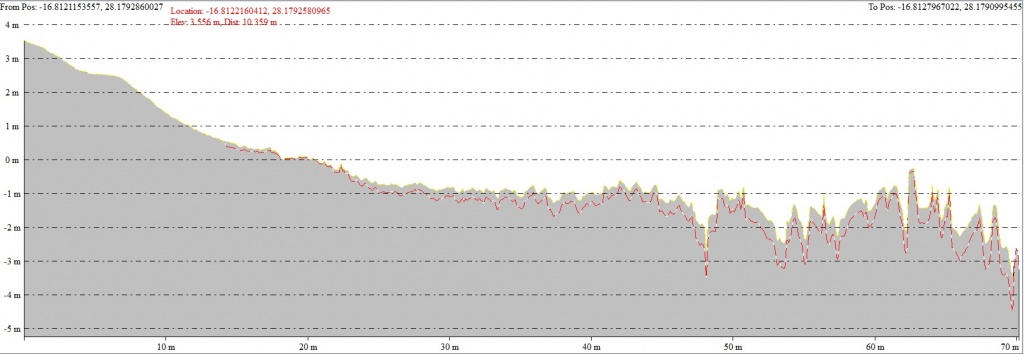
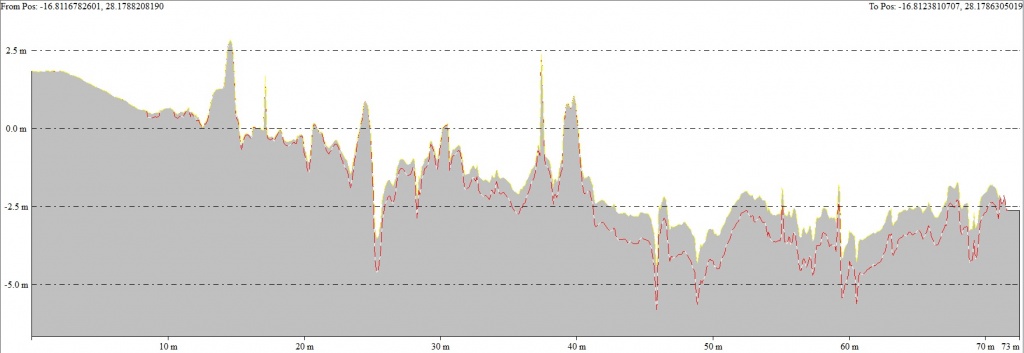
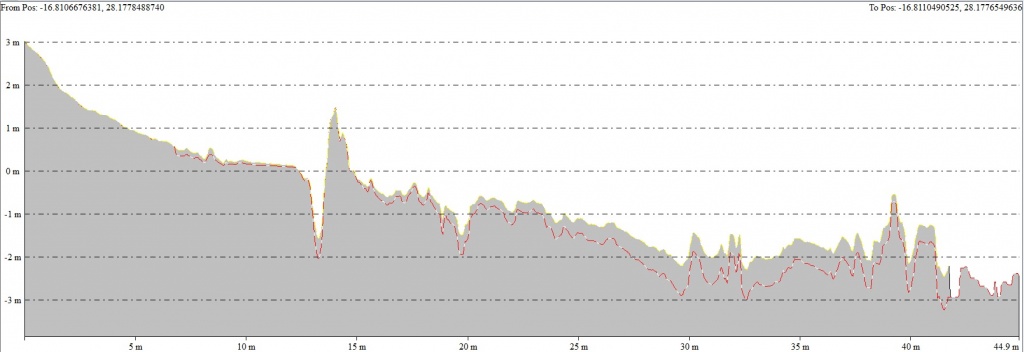
Img. 18,19. Plan view from the profiles used to check the effect of the water refraction correction and real RGB underwater penetration.


Img. 20. Lower profile corresponds (red dashed line) to AUV refraction corrected data, higher profile corresponds to AUV data without refraction correction.
Topo-bathy test results
As it can be observed at the map and histogram below, the RGB underwater penetration has worked quite well and we can reach a depth of – 6 m LAT (so, 7 m water column) without much of a problem. The maximum water column penetration has been (reliable data) down to -15 m LAT, and data density is pretty good until the – 9 m LAT as it can be observed in the data diagram.

Img. 21. Final DEM and graph showing the frequencies histogram.
Conclusion
The use of RGB cameras together with GNSS PPK accuracy and the proper data processing can be a very interesting and powerful tool. As it has been explained, with the proper flight mission planning, the use of the right camera filters and settings, can help to get much deeper through the land / water interface.
It is also essential that the environmental factors, such as wind, amount of solar light and water turbidity, are optimised in order to be able to extract the best possible from all our resources.
Further testing and resources would help to develop a much better methodology, but with this test it has already been proven that under certain environmental conditions, low water turbidity and proper tools and planning the results can be better than expected.
|
Start cooperation with an individual consultation on the selection of equipment and services.
|
Order service
|


.png)


